This is the last post of my join series and it's about how to create a Cartesian product table in DAX and in Power Query. If you are wondering what is Cartesian product, google it :) I'm joking come back here :) Okay, serious mode on. First I'd like to share Wikipedia's definition and visual to describe it: 'In mathematics, specifically set theory, the Cartesian
product of two sets A and B, denoted A × B, is the set of all ordered pairs (a,
b) where a is in A and b is in B. In terms of set-builder notation, that is:'


My definition for Cartesian product (in Power BI) is taking two different tables and combining them with all possible pairs of rows.

To get this result in DAX we can use CROSSJOIN function. Microsoft's definition for CROSSJOIN is: "Returns a table that contains the Cartesian product of all
rows from all tables in the arguments. The columns in the new table are all the
columns in all the argument tables." The syntax is pretty simple:
CROSSJOIN(<table>, <table>[, <table>]…)
My formula to obtain the result set on below is:

Like it's obvious from syntax, we are not limited to only two tables. We need different column names in every table, otherwise, it returns an error. Keep in mind that the function is not supported for use in DirectQuery mode or row-level-security RLS rules. I also want to emphasize that in this example, the columns are in the same order with parameters. Other than these, I'd like to add that we can create Cartesian product table by using GENERETE and GENERATEALL functions as well. But I'm not going to show how to do it with those functions, because their real power comes from creating inner join and left/right outer join combined with some other functions, which is the subject of another post.
Now I want to ask a hypothetical question. Is it possible to create Cartesian product of two tables with filtered rows? The answer is yes! DAX can be quite cool sometimes. For example, I want to create a Cartesian product of two tables but I don't want to include 'Hat' in my result-set. How can I do that?

It's as simple as that! What makes this possible is: the idea that wherever we can use a table name in the parameter, we can also use a table function, like FILTER, CALCULATETABLE, etc. The other thing that I'd like to emphasize is, despite the fact that the Product table is the first parameter of the formula, in the result-set, product table columns come after the Stock table columns. It shows that the order of columns is not always related to the order of parameters.
To create a Cartesian Product table in Power Query, first, we need to choose one of the tables. Which one comes first doesn't change the number of rows in the result-set table, but it changes the order of columns. In this example, I choose the product table and click on Custom Column. After that, to the custom column formula part, I write only the name of the table that I want to combine, being 'Stock', and click OK.
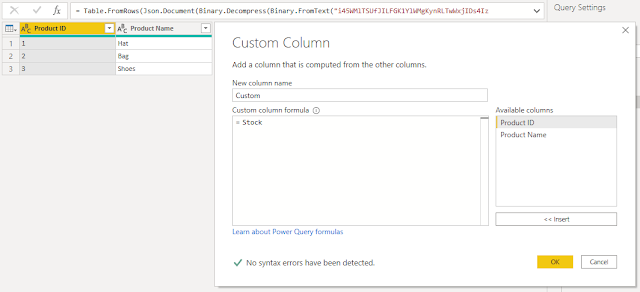
And this is the result after expanding newly added columns.

To create a Cartesian product table with more than 2 tables, we can add the name of other tables to Custom Column formula part with "&". To filter the result-set, we can simply choose the column and filter. If you prefer hard-coding, here is the M formula to do it in Advanced Editor.

This is all I want to say about Cartesian product. End of my join series. My next post is going to be about solving data type conflicts in Power BI and, wait for it, in SQL. Stay tuned.
Comments