
Why And How To Use CROSSFILTER

A relationship between two tables can be unidirectional or bidirectional. When it is unidirectional it filters from one side to many side, not the other way around. If we need to filter from both sides, we can make the relationship bidirectional but it might come with a heavy cost. Having too many bidirectional cross-filter in a data model creates ambiguity between relationships and it might give us wrong results in the end. If this sounds Chinese to you, look at the modal below: 


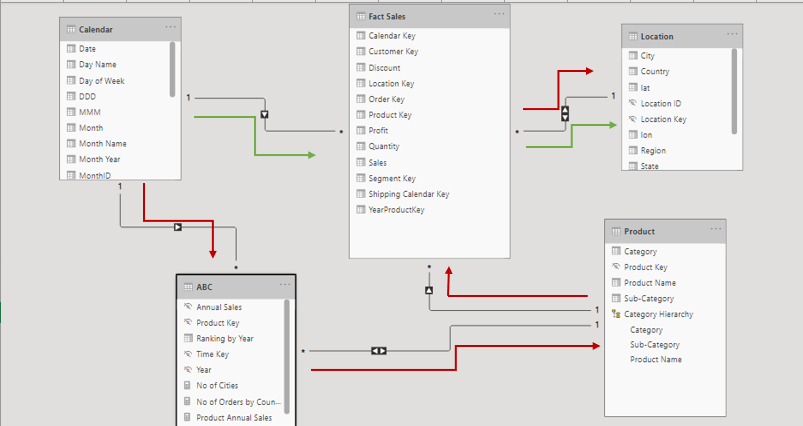
On this modal there two paths to reach from Calendar Table to Location Table. When there are multiple paths between tables, Power BI might find the right way to propagate filter or it can't, thus give us wrong results with our calculations without even complaining about relationships. That's why bidirectional cross-filter relationships can be dangerous and we should stay away from them. But how? What if we need to filter from both tables which have unidirectional filters. In this situation, we can actually create a virtual bidirectional cross-filter relationship by using DAX. The function we need for that is called CROSSFILTER. 


Let's say we want to see the number of orders which is on the Orders Table based on Country which is on the Location Table. Right now it's not possible to get the right number because the filter doesn't propagate from one table to another. Because relationships go in the direction of arrows. In this situation, we have two options. First one, we can set relationship bidirectional between Orders and Fact Sales tables, so that it can reach to Orders Table. But as you see in the first example, when we have a complex modal, it might create issues after some time. The other option is using CROSSFILTER function in DAX to create a virtual relationship. Microsoft's definition for the function is: "Specifies the cross-filtering direction to be used in a calculation for a relationship that exists between two columns." And the syntax is: 

CROSSFILTER(<columnName1>, <columnName2>, <direction>)


No of Orders measure doesn't give us the right result as we expected because the direction of the relationship doesn't allow that. On the other hand, the measure with CROSSFILTER function gives us the right result by creating a virtual bidirectional cross filter. I didn't change anything on the modal, it stays like in the picture. Cool right? If you are thinking about using this function, keep in mind that the third parameter on the syntax represents cross filter direction and it can be set as one, both, or none. Other than that, it can be used only with functions like CALCULATE, CALCULATETABLE, etc. which take a filter as an argument. 

Comments

Popular posts from this blog

Manipulating Grand Totals with ISINSCOPE in Power BI

ISINSCOPE function was introduced in with November 2018 Power BI update. We can say it's a very young player in the game, but it's definitely magic. It can be used to manage lots of issues related to hierarchies, but in this post, I'm going to focus on manipulating the grand total line with it.  This is my budget forecast table. The budget forecast that you see for every month is not the forecast for every month, but it's the forecast for the whole year. The budget forecast for 2020 has changed every month. That's why we have different numbers for every row. Below you see the table visual with the year-month column and a measure that shows the values for every month. The thing that I want you to pay attention to is the total line. I wanted to see the last month's value for the total line and this is the measure for that.  This measure calculates this: If the year-month column has one value then take the average of that value. If it doesn't have one value, li...

How to Add Flags to Power BI Reports

Adding flags to Power BI Reports might be easier said than done. If you have a dataset which contains data of various countries, adding country flags looks cool. The process to do it, on the other hand, might be compelling. Now I am going to share with you the obstacles I  have faced during the process and of course, how I overcame them. First I made an excel list of countries that my dataset has. Then I have downloaded to my computer all the flags I need from Wikipedia and converted them to Base64 link via an image encoder website  base64-image.de  and added those links to my excel file, which looks like this: After I added my excel file to Power BI, I converted the data category of URL column from 'uncategorized' to 'image URL', which might be a small step for you but it's a big step for the success of the flag operation. Then I created one to many relationship with DimLocation table and chose 'both' as filter direction, so that I can filter from both t...

Solving Data Type Conflicts in Power BI and SQL

Whether we like it or not, error messages are part of our lives. The other day, I faced one of those little horrid yellow messages. For me, it's impossible to stay chill when I see that message. For a second, I feel alarmed and panicked. Let me show you what I'm talking about. The first column is the customer code, quite self-explanatory. The Registration Date column shows the date when the customer registered to my shop. The First Sale Date column shows the date when the customer bought something for the first time. And this is what I'm trying to see in the Sales Day column: If Registration Date and First Sale Date are the same, meaning customer bought something at the same day customer registered to my shop, print  "First Day", otherwise show the data of First Sale Date column. But computer says no! It says "Expressions that yield variant data-type cannot be used to define calculated columns." If I need to translate it in simplified English, it means: ...